Economic Loss Analyser Overview
The Economic Loss Analyser helps you quantify past and future economic loss for personal injury claims. It compares a claimant's actual earnings against what they would have earned but for the injury, using ABS Average Weekly Earnings (AWE) data, historical tax rates, and superannuation. The result is a detailed, defensible calculation of economic loss -- split into past and future components relative to a forecasted settlement or judgement date -- that you can export as a comprehensive Word document for correspondence, mediation, or court.
The typical workflow is: upload the claimant's ATO earnings data, add ABS AWE comparison earnings for their industry and gender, and the chart immediately shows where the injury occurred and the deviation between the two earnings trajectories. From there you can add modifiers to model promotions or career breaks, set a loss period and impairment percentage, and generate a full report with tables, charts, and methodology notes.
When to Use It
Use the Economic Loss Analyser when you need to:
- Calculate past economic loss from the date of injury to trial or settlement
- Project future economic loss using ABS AWE growth data or custom estimates
- Account for tax, superannuation, and Medicare levy in your loss calculations
- Compare scenarios with the Loss Line and impairment percentage adjustments to smooth out non-injury-related earnings fluctuations
- Model career changes using modifiers to account for promotions, workforce breaks, or industry changes
- Visualise the loss with an interactive chart that shows the gap between earnings trajectories, with annotations marking key events like the date of injury
- Produce a report suitable for submissions, correspondence, mediation packs, or inclusion in a brief -- including full methodology notes
How the Interface is Structured
The Economic Loss Analyser is divided into several key sections:
Earnings Tables (Left Panel)
Two collapsible panels sit at the top of the page:
- Claimant Earnings -- the claimant's actual earnings history, typically sourced from ATO income statements or tax returns. Each panel header shows the number of data items and provides controls to toggle visibility, refresh, clear, or expand the table.
- Comparison Earnings -- the earnings the claimant would have received but for the injury. Typically sourced from ABS AWE data for their industry, gender, and employment type (e.g. Male, All Industries, Full Time Ordinary Earnings).
Expanding either table reveals columns for Financial Year, Gross Yearly Income, Gross Weekly Income, Tax, Net Yearly Income, Net Weekly Income, and (if enabled) Superannuation.
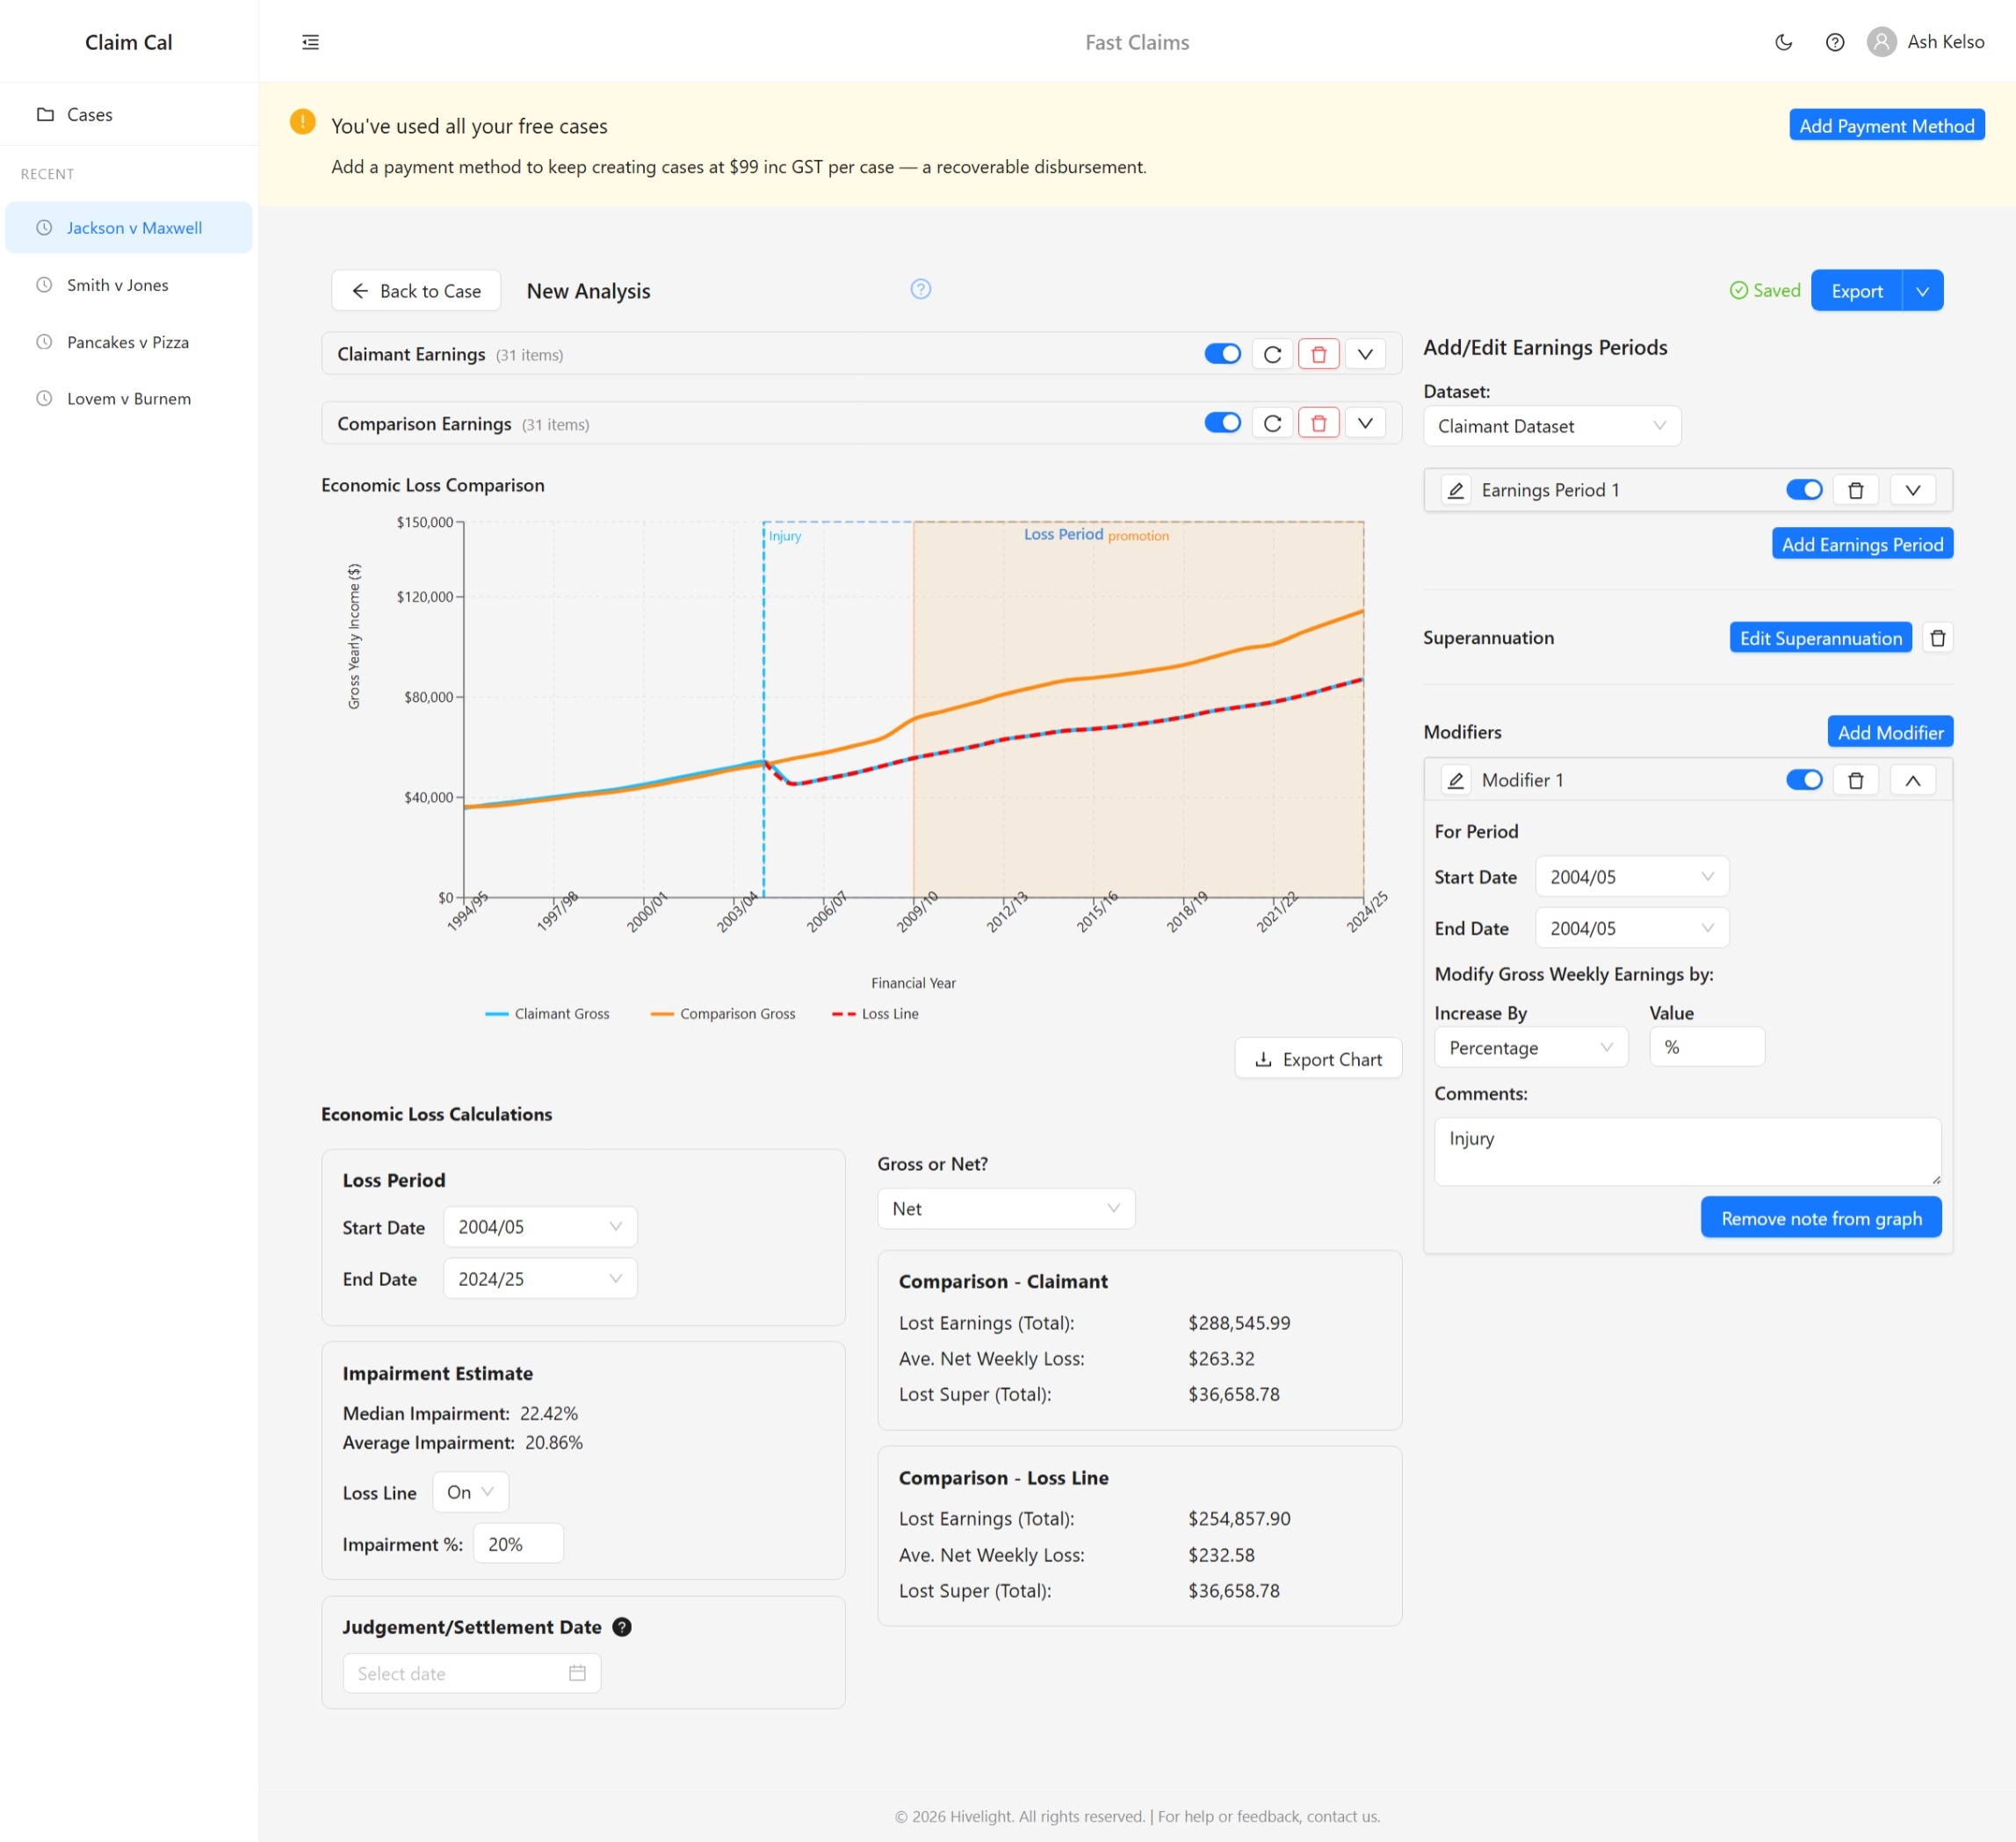
Economic Loss Comparison Chart
Below the earnings tables, a Recharts line chart displays three series:
- Claimant Gross (blue line) -- the claimant's actual gross yearly income
- Comparison Gross (orange line) -- the but-for gross yearly income
- Loss Line (red dashed line) -- the comparison earnings adjusted by the impairment percentage
The shaded area between the comparison and claimant lines represents the loss. A dotted outline marks the selected Loss Period. You can export the chart as a PNG image.
Economic Loss Calculations
Below the chart, you set the calculation parameters:
- Loss Period -- the start and end financial years over which to calculate loss
- Judgement/Settlement Date -- splits results into past and future economic loss
- Impairment Estimate -- shows the empirical impairment percentage derived from the data, with a manual impairment percentage input for the Loss Line. The Loss Line smooths out non-injury-related fluctuations in the claimant's actual earnings
- Gross or Net -- toggle between gross and net loss results
- Result cards -- display Total Loss, Past Loss, Future Loss, and Future Loss Average per Week for both Comparison v Claimant and Comparison v Loss Line scenarios, covering Income (Gross), Income (Net), and Superannuation
Add/Edit Earnings Periods (Right Panel)
A side panel lets you select either the Claimant or Comparison dataset, then add, edit, or delete earnings periods from three data sources: ABS AWE data, Estimate Data, or Upload/Manual Entry. This panel also contains Superannuation and Modifiers controls.
Next Steps
Ready to build your first analysis? See Creating an Economic Loss Analysis.